In previous sections the basic principles behind voltammetry have been introduced. Now we examine the effect of introducing a small sinusodial voltage perturbation in addition to the usual cyclic voltammetry waveform.
AC Voltammetry
AC Voltammetry typically involves the application of a sinusodially oscillating voltage to a electrochemical cell. The AC experiment when used in conjuction with a lockin amplifier or frequency analyser offers considerably increased sensitivity over the early described techniques and can also reveal important mechanistic and kinetic information not easily available using more tradition voltammetric techniques. An AC voltammetric measurement is usually performed in a electrochemical cell where diffusion is the dominate mode of transport. The AC voltage is often combined with either a steady DC signal or voltage sweep, for example, the following figure shows a cyclic voltammetric signal with an AC perturbation
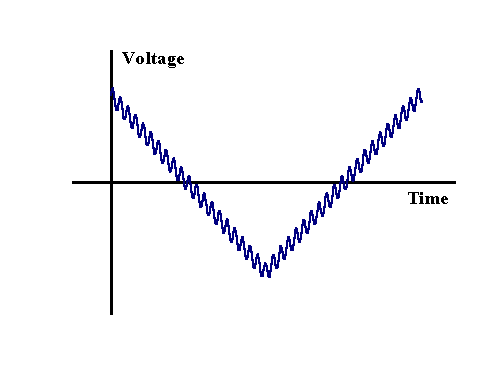
The most important aspect of this figure is the magnitude of the AC perturbation which is seen to be small in comparison to the overall change in voltage occurring during the sweep. Typically an amplitude of 5 mV or less is employed in AC measurements. This small perturbation ensures only slight changes in concentrations occur close to the electrode surface and allows mathematical analysis to assume that the effect on the electrode kinetics can be calculated in a linear manner, even though the electrode kinetics strictly have an exponential dependence on the applied voltage. The figure below shows how the current varies when an AC component is added to a normal CV experiment. In this case the sine wave amplitude (peak to peak) was set as 40 mV, far larger than a true experiment in order to illustrate the current variation.
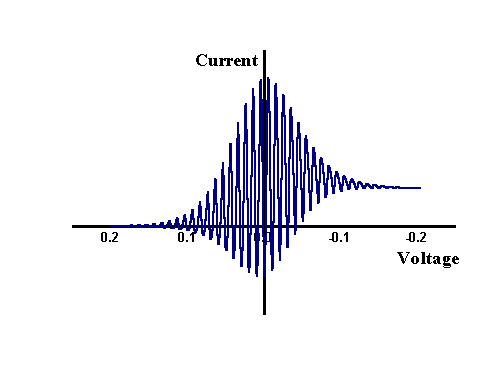
However this is not the signal that is usually recorded or presented from the experiment, since a lockin amplifier or frequency response analyser allows the component of the current which is varying sinusodially to be separated from the dc signal. Passing the signal above through the lockin amplifier provides the magnitude of the change over each cycle and appears as
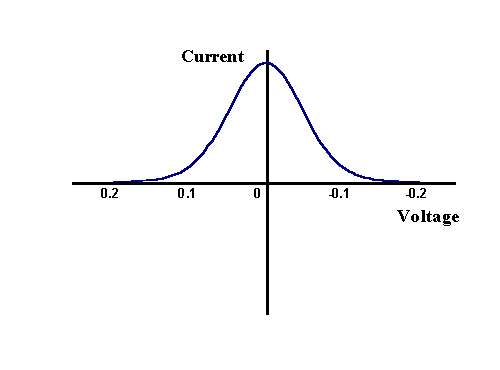
The maximum change is seen to occur at E0 as this is the region where the electrode kinetics are most sensitive to voltage changes, whereas at the two extremes of the voltage range there is no variation since the electrode kinetics are insignificantly affected and so the current doesn't vary. Next we will focus on an individual cycle, to establish the phase relationship between the current and voltage
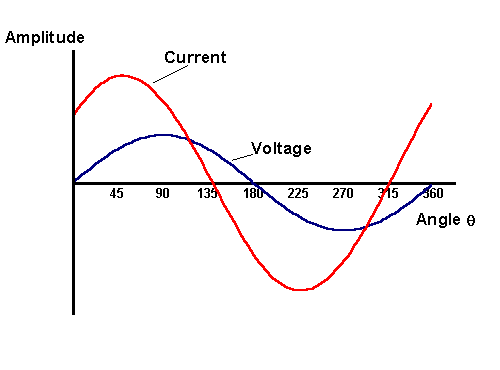
It is clear that the current maximum is shifted from the applied voltage maximum by 45º and this phase shift can be understood by studying the concentration profiles close to the electrode surface during a voltage cycle. Again for illustration purposes a large voltage amplitude has been employed and the concentration profiles generated are shown below
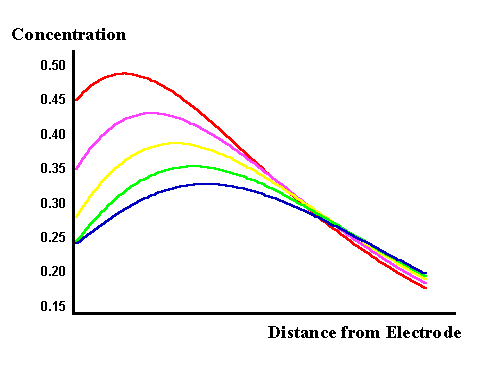
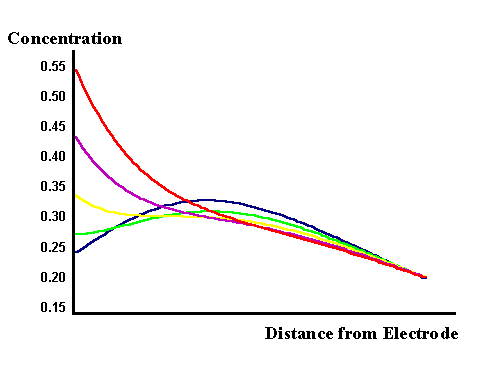
In the top figure the voltage is dropping from zero to the negative minimum and the surface concentration of the reactant is dropping as expected. However the current is dependent upon the flux of material to the surface and the maximum of this flux occurs between the yellow and mauve curves. The origin of the phase shift can therefore be seen to result from the diffusional process occurring. Mathematical analysis of the phase relationship by solution of Fick's laws for the reversible AC voltammogram shows that the phase angle seen in the above voltammogram is exactly as predicted. The lower figure shows the concentrations as the voltage moves from the minimum back uptowards the zero line. The gradient can be seen to change direction and consequently a current begins to flow in the opposite direction to that in the top figure. Also a ripple in the concentration profile is seen as the diffusion is unable to keep up with the changes induced on the surface, hence again the phase difference between the voltage and current. We will discover later in the impedance discussions the effect of the electron transfer kinetics on the voltammetry.

