Cyclic voltammetry can be used to investigate the chemical reactivity of species. To illustrate this let us consider a few possible reactions.
The EC mechanism

The notation for electrolysis reactions was first proposed by Testa and Reinmuth with any electrode steps being labelled E and any chemical steps labelled C. Hence the above reaction is referred to as the EC reaction. The mass transport equations for this reaction when diffusional transport is dominant are


The mass transport equation for species (O) is identical to the case when no chemical reaction occurs, species (R) however has an additional term to account for the fact that it is destroyed chemically by a first order reaction. It is possible to gain information about the chemical rate constant kEC by studying the reaction via cyclic voltammetry. The figure below shows a cyclic voltammogram recorded for the EC reaction when the electron transfer reaction is reversible and the chemical rate constant kEC is extremely large.
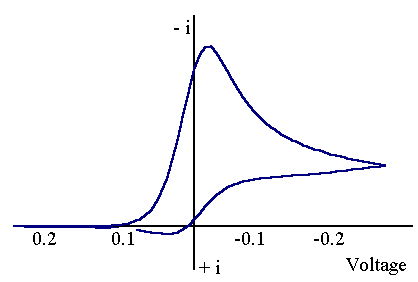
The voltammogram can be seen to be significantly different from that observed when no chemical reaction occurs. The reduction in size of the reverse peak occurs since much of the (R) that is made electrochemically is destroyed by the chemical step. So whereas for the case when (R) is stable an oxidative current flows when the voltage is swept back now there is little reconversion of (R) back to (O) electrochemically and thus little oxidative current flowing.
The next figure shows the corresponding voltammogram for cases where kEC varies from very large to very small. The scan marked in mauve corresponds to that observed when kEC is large as discussed above. As can be seen from the figure as kEC decreases the current voltage curve moves to more negative (reductive) potentials and also a back peak begins to be observed. The red line corresponds to the case when kEC is extremely small and is essentially identical to that recorded for the case when R is chemically unreactive.
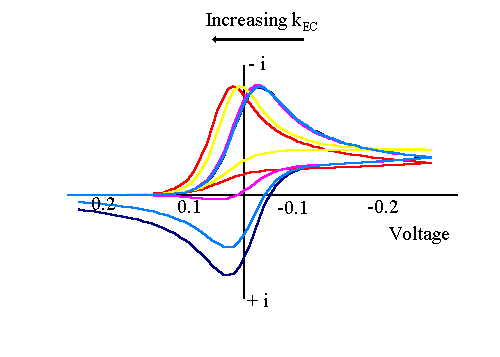
The size of the back peak can be explained in terms of the amount of material that reacts during the scan. For very small values of kEC (R) is essentially unreactive on the timescale of the voltammetric measurement and so no difference is observed between this and the stable reversible electron transfer reaction. As kECincreases the size of the back peak begins to decrease due to the removal of (R) by chemical reaction. Once kECreaches a certain value all of (R) is removed chemically and no back peak is observed. By analysis of the back peak height it is possible to evaluate the value of kEC.
The reason the wave position shifts as kECbegins to increase results from the desire of the electrochemical system to set up an equilibrium controlled by the applied voltage. In the case of reversible electron transfer reactions the ratio of (O) and (R) at the surface can be predicted by the Nernst equation at any particular value of applied voltage. The chemical reaction acts to remove (R) so when this happens the applied voltage forces more (O) to convert to (R) electrochemically to restablish the required ratio. As more (O) is converted to (R) this results in the flow of more current and the wave begins to shift anodically (for a reduction).
All of the above voltammograms have been recorded at a fixed voltage scan rate. However if the scan rate is altered we are likely to observe a slight variation in the voltammograms recorded. The figures below show two voltammograms recorded for the same reaction but at different voltage scan rates.
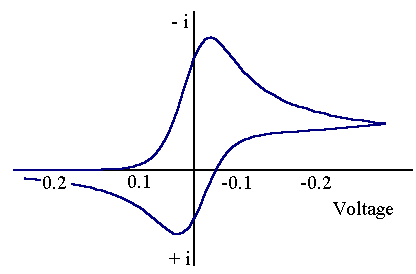

The top voltammogram has been recorded at a faster scan rate than the bottom one. Although the total current flowing is different due to factors discussed earlier the important point to note is that on the lower voltammogram only a small back peak is observed yet on upper one the back peak is of a similar height to the forward peak. Of course the reason for this is due to the time taken to record the voltammogram. As the voltage scan rate is much faster on top scan it is possible that no (R) has had time to chemically react while the voltammogram is recorded. Therefore the current measured shows no evidence of chemical reactivity. The opposite is true for the lower voltammogram. Now the time to record the voltammogram is much longer and most of (R) is seen to be removed and therefore no back peak is detected. By varying the scan rate it is therefore possible (sometimes) to 'outrun' the chemical reaction. The EC mechanism is perhaps the simplest example of a coupled homogeneous chemical reaction. A slightly more complex case is the ECE reaction
The ECE mechanism
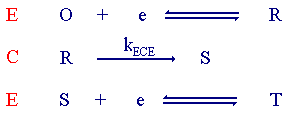
The first step is similar to the EC process. However now the product for the chemical reaction (S) is also electrochemically active. The figure below shows the voltammogram for an ECE mechanism where the product (S) is more difficult to reduce than the starting material (O).
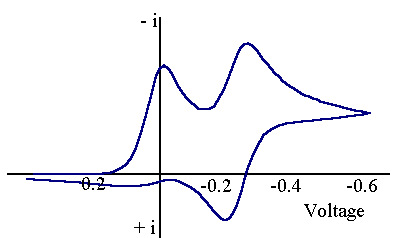
The scan starts from the left hand side and the first feature is the reduction of (O) to (R). However now if the scan is taken further a new peak is observed for the reduction of (S) to (T). On the reverse scan a back peak is seen for the (S/T) couple but only a small peak is observed for the (O/R) couple. Clearly for this reaction the chemical rate constant is 'fast' (compared to the voltage scan rate) and so almost all of (R) is removed by chemical reaction. Slightly different behaviour is seen if the product (S) is more easy to reduce:
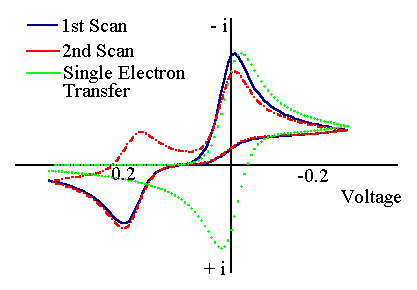
Now on the forward sweep a single peak is observed, which is larger than that for the (O/R) couple alone. This arises since when (S) is formed it can be directly reduced to (T). On the reverse scan a small back peak is observed at the position of the (O/R) couple and then the species (T) is oxidised back to (S) at more oxidative potentials. In these experiments a second scan is often performed since some of the product (S) will be still close to the electrode surface and can be reduced at the appropriate voltage on the next scan through.
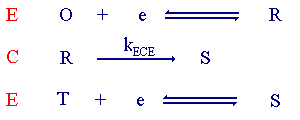
A further example of a ECE 'like' process is shown below.
The type of voltammogram recorded in this case is shown below.
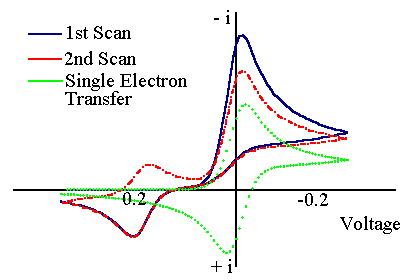
See if you can rationalise the behaviour here! The final electrochemical mechanism we shall consider is a catalytic one
The EC' mechanism

This reaction is referred to as the EC' mechanism. The prime (') on the C representing a catalytic process. In this case the chemical reaction regenerates the starting material (O). The figure below shows the corresponding cyclic voltammogram recorded for these types of reactions with different quantities of (Y) added to the solution
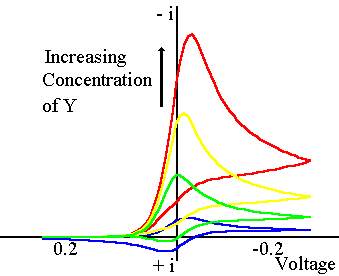
The current voltage curve with the lowest current corresponds to the case where no (Y) has been added to the solution and therefore no chemical reaction occurs. However as (Y) is added the reaction can begin and for a fixed scan rate and concentration of (Y), the current will be higher than when no (Y) is present in solution. This of course is due to the fact that the reactant (O) is regenerated during the reaction and can therefore react again at the electrode surface. As the quantity of (Y) is increased the current also increases since more chemical reaction occurs.

