Introduction
In this part we introduce impedance and the representation of the inputs and outputs from electrical circuits in phasor form. We also outline the use of Bode plots for the presentation of the phase angle and magnitude of the current response.
Impedance
The impedance (Z) of a circuit is its opposition to the current, so for example in a circuit composed purely of resistors the impedance is exactly equivalent to the circuit resistance. However as we shall see in the next section when a sinusoidal voltage is applied to a circuit containing components such as capacitors and inductors, the current response is also sinusoidal but occurs with some sort of phase shift. In these situations we must quantify both the signal magnitude and the phase relationship between the voltage and the current. So the impedance can be represented by

which in this case shows both the current and voltage have a phase angle of 0°. Before we look in more detail at the phase properties of circuits we need to see how to present the sinusoidal voltage input and corresponding outputs graphically.
Phasor Representation of a Sinusoidal Voltage
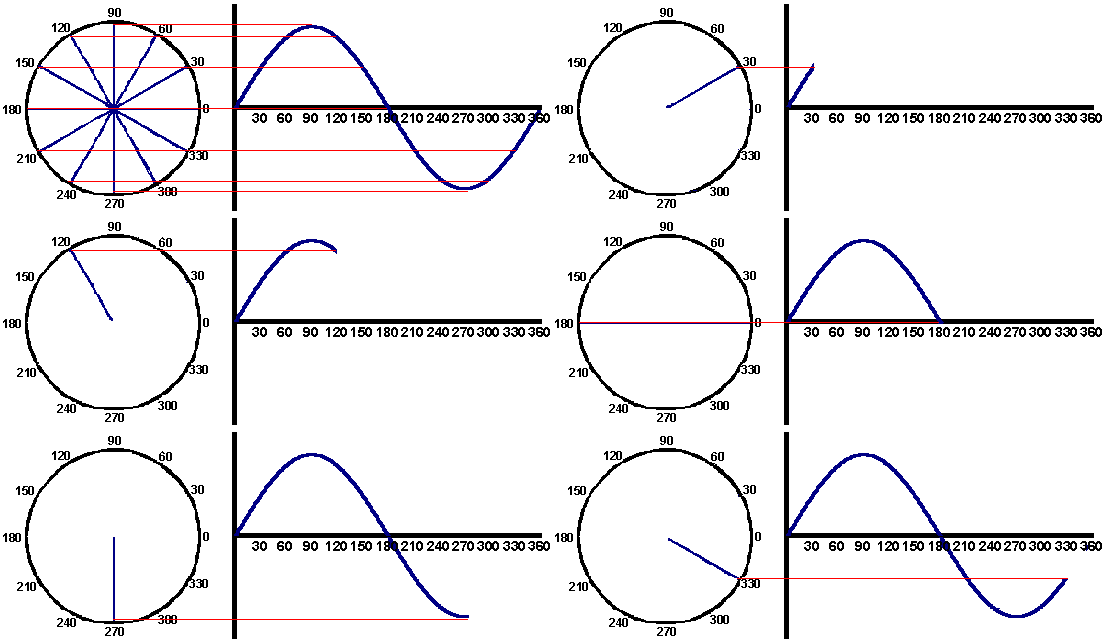
In the later sections of the AC circuit analysis we employ a syncytial voltage as the source to probe the frequency response of electrical circuits, consequently we must be able to represent this these functions graphically and mathematically. Below the animation shows a sinusoidal voltage supply in angular and phasor form

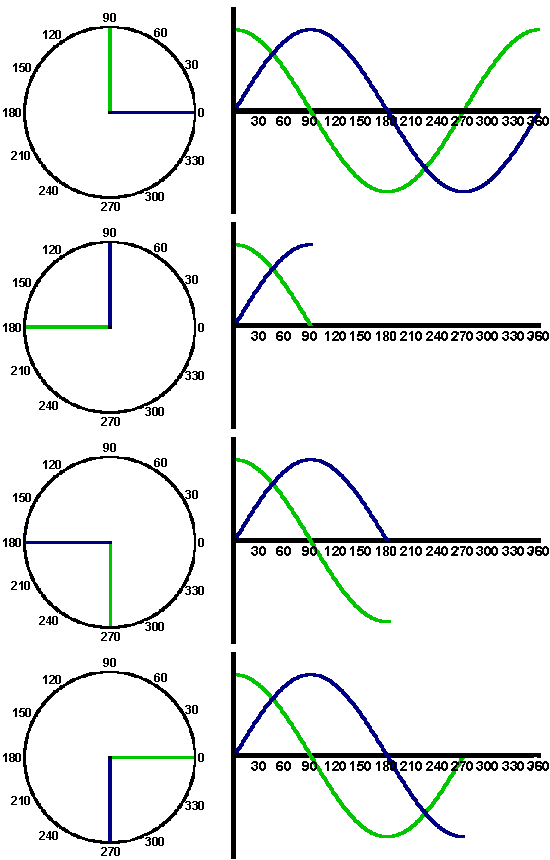
As mentioned above the current response is often shifted out of phase with the applied voltage, for example in the plot below there is a 90° difference in the phase of the dark blue and red curves.

This information can be readily plotted on a phasor diagram which is also shown in the animation. The above illustrates the advantage of representing sine waves in a phasor form, since the phase and magnitude relationship between the two curves is readily seen by just two lines. This benefit becomes more significant as the number of signals increases, as the angular representation rapidly becomes difficult to interpret the phasor form remains relatively straight forward to follow.
Bode Plots
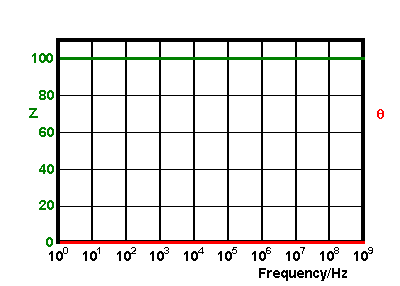
Bode plots offer another way of presenting phase and magnitude information from a rotating vector. This form of presentation is particularly useful for measurements performed over a wide range of frequencies, which often result in a large amount of information being cramped into a small section of a phasor diagram. The general form of a Bode plot is shown below

here the magnitude of the vector and the phase angle are plotted against the log of the frequency. In the plot above the magnitude and phase angle do not change as a function of the applied frequency (this is characteristic of a circuit containing only resistors). We will see in latter sections how these plots can help reveal more about the current flow through RC circuits.
In the next section we use the above information to begin to examine how circuits containing only one type of component (resistors, capacitors or inductors) behave as a function of an applied sinusoidal voltage.

