The group has a broad range of experience in the development of numerical techniques for application in the field of microreactors and electrochemistry; these can be used to optimise the device design and operating conditions (computer aided design) and for the quantitative analysis of experimental results. The numerical models are used to calulate properties such as concentration distributions, fluid velocities, temperature variations and potential distribution within these environments. Some of the methods developed by the group include:
- Finite Difference (FD)
- Finite Element (FE)
- Boundary Element (BE)
- Lattice Boltzmann (LB)
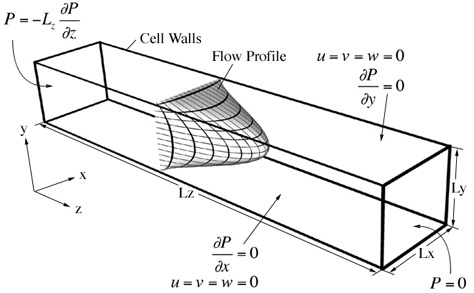
In a typical simulation we may wish to understand the fluid velocity within a microduct. Solution of the appropriate form of the Navier-Stokes equations subject to certain boundary conditions allows the prediction of fluid dynamics within the structrually well defined reactors (see below).
The fluid velocity is then used in the convection-diffusion equation to determine the distribution of the species within the device:
![]()
Some examples of the problems solved using numerical simulations are shown below.
Studying the effect of non-standard flow profiles on the electrochemical response
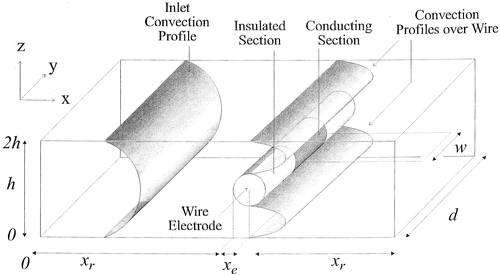
In order to obtain quantitative information from experimental electrochemical studies, a numerical model of the mass transport and chemical reactivity is required. A finite element model of hydrodynamic voltammetry at the wire electrode (shown below) was developed to calculate the flow profile around the wire, some of the results are shown below.
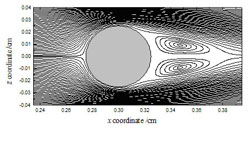
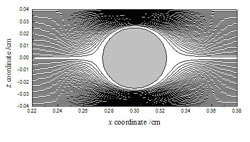
The image on the left is the calculated velocity profile for fast flow around a microwire electrode and the image on the right is the corresponding velocity profile for slow flow.
Electrochemical flow visualisation
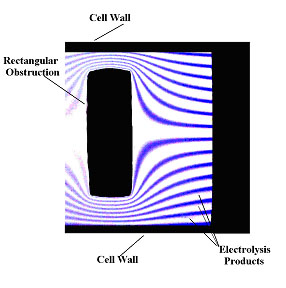
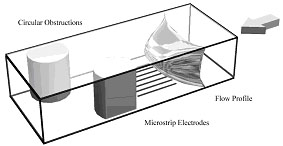 A combined numerical and experimental study was performed to asses the use of hydrodynamic voltammetric techniques for visualising flow within a microfluidic device. Using standard microfabrication techniques thin electrodes were positioned in the direction of flow at the bottom of a microfluidic device; obstructions to the flow were then positioned downstream of the electrodes (see the schematic to the right). An electrolysis reaction was then initiated at the electrode surface which produced a coloured species enabling the imaging of the streamlines. Using this approach, the effect of the size and shape of the obstruction as well as the volume flow rate on the fluid flow was investigated.
The images below show the simulated response of the flow around both a single and double rectangular obstruction using finite element techniques.


The numerical model was compared to experimental images such as the one below, and a good agreement between the two approaches was observed.
Quantification of chemical reaction kinetics
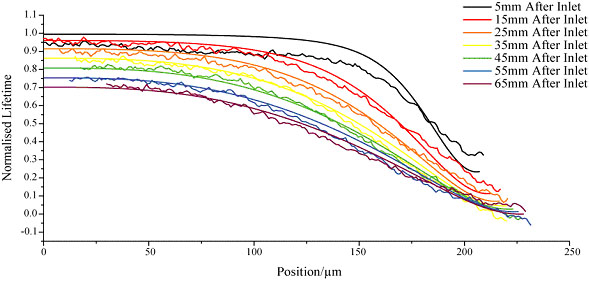
Finite difference techniques were used to for the analysis of chemical reaction kinetics. Experimental data for a chemical reaction between an acid chloride and an amine was obtained using fluoresence lifetime imaging microscopy (FLIM), this was then compared to numerical simulations in order to determine the rate constant for the reaction; the experimental and simulated profiles and images are shown below. This approach provides an alternative method for the study of fast reaction kinetics.

Voltammetric sizing and locating of spherical particles
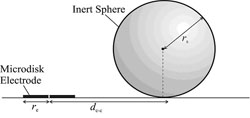 In collaboration with Prof. Richard Compton we have develop a novel numerical and experimental technique for the determintation of a sphere's size and location (see schematic). The change in response of a microelectrode due to the presence of an inert sphere was studied using experimental and numerical techniques; this understanding of the response can then be used to predict the unknown size or location of a sphere. A 3-dimensional lattice Boltzmann model was developed to investigate the effect of parameters such as electrode size and sphere size and location; some theoretical results are shown below.
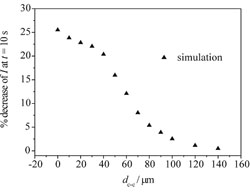
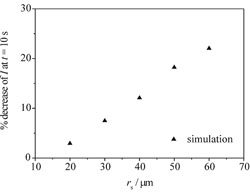
The graph on the left shows the effect of incresing the distance between the centre of a 40μm electrode and an inert sphere. The graph on the right shows the effect of increasing the radius of an inert sphere positioned 60μm away from a 40μm electrode.

