I. Inkjet Rheology and Processing
Liquid micro-droplet formation is relevant to several applications where the deposition of a controlled volume of fluid on a specific location is required and inkjet printing is one of the most well known. Several methods to obtain this objective, such as Continuous Ink Jet (CIJ), Drop on Demand (DoD) or Bubble Jet, create a ligament of fluid that breaks due to Rayleigh instabilities. Both surface tension and viscosity play an important role and, as a consequence, the fluid rheology is of tremendous importance. However, the scientific literature lacks information, mainly because of the timescale associated with the process (few microseconds), the complexity of the jetting process and the low viscosity of the liquids used. Inkjet fluids are low viscosity (1 to 20 mPa.s typically) complex fluids constituted of several components (including polymer, pigment or die) that induce a low viscoelastic behaviour that manifests in the ms domain or below. This viscoelasticity affects the way drop form at the printhead and filament break up mechanism downstream of the printhead, but cannot be detected by normal mechanical rheometer as their frequency limit is usually around 50Hz and they are not sensitive enough at such low viscosity.
In the DoD printhead, the applied wave form leads to deformation of a piezoelectric ceramic wall that compresses the fluid contained in the micro-capillary channel. The wall amplitude of the deformation is of order of tens of nanometers and the pulse width is of order of 10µs. A pressure wave resulting from the motion of the piezoelectric actuators acts against the fluid surface tension and viscosity to move the fluid through the nozzle. A ligament of fluid with a large aspect ratio (D/L ≈ 50) is then ejected from the orifice. In term of rheology, the process of formation of droplet can then be separated into two different elements. Within the printhead, small deformations and fast timescale requires the study of the linear viscoelasticity (LVE) of the fluid whereas outside the printhead, the elongation character of the fluid flow requires the study of both the linear and the non linear viscoelasticity (NLVE).
Special experimental techniques are required to probe the fluid rheology under the relevant high strain and strain rate conditions and the apparatus used in this project are described below.
II. Linear Viscoelasticity of Low Viscosity Fluids
a. The Piezo Axial Vibrator (PAV)
Droplet formation is a very delicate process and the ink jet fluids fall into the class of potentially weakly viscoelastic, low viscosity fluids where the relaxation modes are usually in the time domain of milliseconds or below. The quantification of the ink jet fluid composition linear viscoelasticity (LVE) in the timescale of ms and µs is therefore desirable and the Piezo Axial Vibrator (PAV) [Crassous et al. (2005)], that can access the relevant time domain for ink jet fluids, is presented here.
The Piezo Axial Vibrator (PAV) is a dynamic squeeze flow rheometer that operates at frequencies between 1 to 10,000 Hz (below its resonance frequency) that has been used to characterise linear viscoelasticity (LVE) of soft matter fluids such low viscosity polymeric solutions [Crassous et al. (2005), Hoath et al. (2009)]. The PAV is built around 4 thin walled stainless steel rectangular tubes on which 8 piezoelectric (PZT) elements are glued (2 on each side of each wall: inside and outside) (Fig. 1.b). Four active PZTs are attached to two opposite walls of the tube in order to exert vibrations while additional passive PZTs are fixed to the remaining sides in order pick up the response signal. The top section of the tube and cylinder are tightly covered by a thick stainless plate (which serves as the bottom plate of the sample) with a circular radius R (Fig. 1.a). Using a stainless steel microfoil distance ring, the PAV can be hermetically closed with a thick stainless steel, glass or sapphire top plate, leaving a circular gap of depth d (between 5 to 200mm) to be filled by squeeze flow of a test fluid. The lower part of the device is surrounded by a double walled cylinder allowing the circulation of fluid for temperature control.
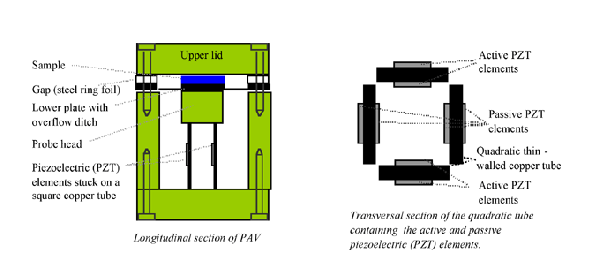 |
| Figure 1: Longitudinal and transversal sections of the PAV |
 |
| Figure 2: PAV measurement of mixture of ( |
 |
| Figure 3: Complex viscosity enhancement as a function of the loading (♦) PS110 in DEP and (▲) Phthalocyanine blue organic particle in Acrylate-monomers. Experiments performed at 25°C. |
For the range of polymer (0 to 5wt%) and particle (0 to 10wt%) loading investigated, no shear thinning was observed over the frequency range investigated (Fig. 2) indicating a viscous Newtonian behaviour. PAV measurements have also demonstrated that the addition of polymer or particles has the expected effect of non linear enhancement of complex viscosity (Fig. 3). PAV measurements can capture the development of a viscoelastic component G’ in the case of both particle and polymer additions. By using mixtures of miscible chemically similar carrier fluids, the elastic behaviour G’ development of the suspensions has been studied independently of the complex viscosity. The introduction of polymer results in the progressive development of elasticity with both frequency and concentration following a “Maxwell-like” behaviour. In that case, the elasticity originates from the entropic elasticity of the coiled polymer chains and it results in a G’ slope of 2 and a G’’ slope 1 (Fig. 4). Fitting these results with classical Zimm model in its mono mode configuration leads to obtain relaxation time between 16 and 30 µs is the present case.
 |
| Figure 4: PAV measurement, at 25°C, of dilution of PS110 at (♦) 0.2wt%, (▲) 0.5wt% and (∆) 1wt% in DEP; [Vadillo et al. (2010)]. |
Addition of particle also results in high frequency elasticity development in a non Maxwellian-like way. Again, G’’ was found to increase linearly with frequency although G’ slope was found to be closer to 1 than 2 (Fig. 5). The observed non-integer behaviour of the slope of G’ was assumed to come from the complex nature of the fluid particle-particle interaction. Despite the clear experimental evidence the effect of particle on the linear viscoelasticity of the fluid, no model can yet predict such behaviour.
 |
| Figure 5: the G’ development of matched viscosity particle suspensions of phthalocyanine blue organic diluted in acrylate-monomers at different concentrations. Concentration of (■) 2wt%, (♦) 4wt%, (▲) 6wt% and (∆) 8wt%. Temperature: 25°C; [Vadillo et al. (2010)]. |
b. Diffuse Wave Spectroscopy (DWS)
The DWS technique has been recently developed from the work performed by D. Pine and D. Weitz [Pine et al. (1988)]. The technique consists in propagating a laser beam into the sample and measuring either the transmitted and or the back scattered light that has been deflected (or reflected) by the tracer particles introduced into the sample. A simplified diagram of the experimental configuration of the DWS is presented in Fig. 6.
 |
| Figure 6: Diffusive Wave Spectroscopy setup, schematic diagram. |
The light Intensity Correlation Function (ICF or g2(τ)-1) fluctuation at different lag time τ can directly be related to the mean square displacement <r2(τ)> (MSD) of the tracer particles under the action of Brownian motion [Manson and Weitz (1995); Gittes et al. (1997)]. The MSD is directly linked to the fluid complex viscosity via the generalised Stokes-Einstein equation (eq.1):
 |
(eqn. 1) |
where ω is the frequency in rad/s, kB in the Boltzman constant, T is the temperature in Kelvin, a is the diameter of the tracer particles and ![]() is the Fourier transformed of the MSD. This technique is able to probe the linear viscoelastic properties of fluids up to 107Hz.
is the Fourier transformed of the MSD. This technique is able to probe the linear viscoelastic properties of fluids up to 107Hz.
Preliminary experiments have demonstrated an excellent agreement between PAV data and DWS data (Fig. 7) in the case of polymer solution. This technique can complemented the PAV data to reach higher frequencies and ideally covers the frequency range relevant to inkjet printing.
 |
| Figure 7: Comparison between PAV (symbols) and DWS (solid line) data for 5wt% PS110 in DEP, (■) G’’, (■) G’ and (◊) η*. |
III. Cambridge Trimaster (CTM) non linear rheology and processing
When fluid is released from the printhead, it is subjected to a fast extensional stretching flow. The growth of Rayleigh instabilities and the eventual subsequent break up is strongly affected by the low viscoelastic character of ink jet fluids. The Cambridge Trimaster probes the extensional and non linear rheology of such fluids using aspects of capillary thinning rheometers [Orr and Sridhar (1999); Anna et al. (1999)]. The method consists of imposing an initial rapid extensional step strain to a given volume of fluid to create liquid bridge, which then subsequently self-thins under the action of viscous, elastic and capillary forces (Fig. 8). The transient Hencky strain can be calculated by the rate of thinning of the mid-filament diameter with time. The low viscosity of inkjet fluids does not easily allow using classical filament stretch apparatus such as CaBER [Anna et al. (1999)] due to the short time it takes for the filament to break after the pistons cessation of motion (typically 5ms for a 10mPa.s fluid).
 |
| Figure 8: Principle of the capillary thinning rheology; [Vadillo et al. (2010)]. |
The “Cambridge Trimaster” has been specially developed to overcome these technical limits and can perform fast stretching (up to 1m/s) over a distance of 10µm to 10cm of filament of fluids initially positioned between to identical pistons. The pistons are attached to a band and a slider enabling them to move in the symmetrically in the opposite direction while maintaining the centre of the thread in a steady position (Fig. 9).
 |
| Figure 9: Picture of the Cambridge Trimaster; [Vadillo et al. (2010)]. |
The filament stretching and thinning profiles are recorded using a high speed camera (Photron Fastcam 1024 PCI), synchronised to the initial motion of the pistons, and photographs of the whole filament profile as a function of time were obtained. This apparatus enables interrogating the drop formation process of low viscosity low viscoelasticity with very well defined boundary conditions.
 |
| Figure 10: Transient profiles recorded using the CTM in the case of (a) Diethyl Phthalate and (b) Diethyl Phthalate + 1wt% of PS110 and (c) Diethyl Phthalate + 1wt% of PS110. D0 = 1.2mm, L0 = 0.6mm, Lf = 1.4mm and U = 150mm/s; [Vadillo et al. (2010)]. |
In the case of a low viscosity Newtonian fluid (Oh < 7.23-1, [Rodd et al. (2005)]), the filament has the form of a cylinder when the pistons stop (5.3ms) and conserves this shape until 6.8ms. The filament loses its uniform shape with faster thinning points located on its top and bottom, eventually ending by two clear break up points and the formation of a unique droplet (Fig. 10.a). The addition of polymer, as well as increasing the base viscosity, adds an extra stress in the filament that acts against the surface tension to stabilise the filament. This results in forming a thinner long lasting filament along which droplets can develop (Fig. 10.b). Further increase in polymer content leads to a thinning mechanism fully controlled by the fluid elasticity, which prevent the formation of droplets on the filament. The filament remains cylindrical until the end and breaks up. The mid-filament evolution has been found to be linear in the Newtonian case of the DEP while addition of polymer results in exponential decrease typical of viscoelastic fluid. It was then possible to extract extensional relaxation time and values from hundredth of microseconds to millisecond have been measured. One can notice that extensional relaxation times experimentally appear to be several order of higher than previously extracted from the linear viscoelastic measurements using the Zimm model. Such result has only been reported in the literature once in the work of [Clasen et al. (2006)].
The mid-filament strain rate can be related to the fluid transient apparent extensional viscosity via equation 2 [McKinley and Tripathi (2000)]:
 |
(eqn. 2) |
where ηE is the apparent extensional viscosity, σ is the fluid surface tension, Dmid is the filament mid filament and X is a shape factor comprises between 0.5 and 1 with 1 corresponding to a perfect cylinder. Addition of polymer increases the fluid apparent extensional viscosity and can reach ηE/η0 of about 250 in the case of 5wt% PS110 in DEP (Fig. 11).
 |
| Figure 11: The transient extensional rheology of DEP solutions as a function of relaxation Hencky strain for different PS concentrations. Initial distance 0.6mm, final distance: 1.4mm, piston velocity: 150mm/s. The lines are obtained from the exponential fitting of the evolution of the thinning of the diameter. The geometrical factor “X” is fitted using the experimental data at low Hencky strain. (♦) DEP, (■) DEP-0.5wt%PS110, (▲) DEP-1wt%PS110, (○) DEP-2.5wt%PS110, (+) DEP-5wt%PS110; [Vadillo et al. (2010)]. |
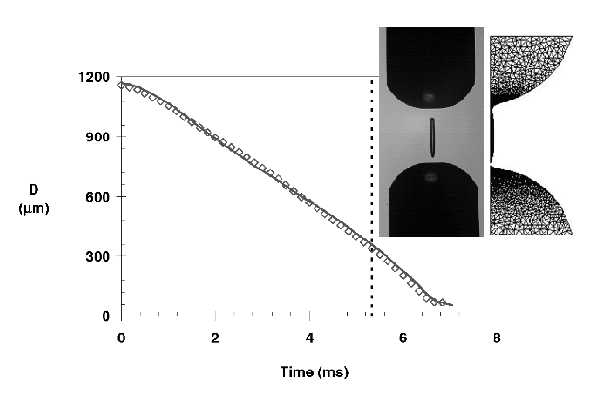
The perfectly defined and controlled boundary conditions enable comparison of the filament break experiments with numerical simulation. Here, the numerical simulations have been developed in the School of Mathematics in Leeds University by Dr. Oliver Harlen. Several constitutive equations are available to include the polymer influence including Oldroyd-B, FENE-Cr or FENE-P.
 |
|
Figure 12: Comparison between (◊) experimental and (-) simulated mid filament evolution. Experimental and simulated transient profiles are visible in insert. η* = 14mPa.s, σ = 37mN/m, ρ = 1120 kg/m3, D0 = 1.2mm, L0 = 0.6mm, Lf = 1.4mm and U = 150mm/s. |
Simulations of filament stretching using Newtonian fluids are in excellent agreement with experimental observation. However, simulations of filament thinning of sample containing polymer are not giving satisfactory agreement with experimental observation. Figure 13 presents comparison between numerical simulations and experimental measurements in the case of DEP + 2.5 wt%.
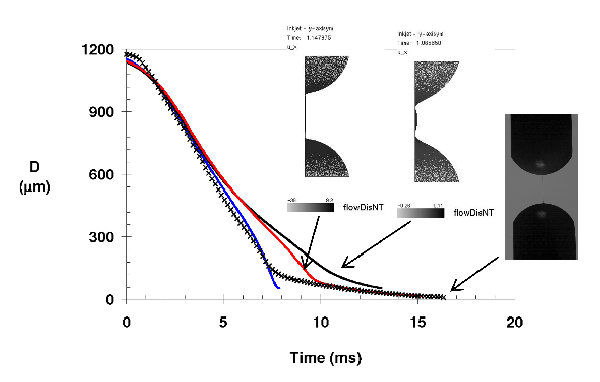 |
| Figure 13: comparison of the mid-filament evolution in the case of DEP + 2.5wt% PS110 for (+) experiments and (▬) Fene-CR 1 mode λ = 30 µs and g = 630 Pa, (▬) Fene-CR 1 mode λ = 1ms and g = 17 Pa and (▬) Oldroyd-B 1 mode sλ = 1 ms and g = 17 Pa. ηs = 13.9 mPa.s, η0 = 31 mPa.s, σ = 37 mN/m and ρ = 1050 kg/m3. |
Results presented here demonstrate that the experimentally extracted relaxation time for both Fene-CR and Oldroyd-B constitutive equations enable predicting the elasto-capillary thinning phase although between 6 and 10 ms the predicted mid-filament diameter is significantly larger than the experimentally observed one. In both cases the break-up is not correctly reproduced although one must notice that in Oldroyd-B case, the simulation has been stopped due to the large number of grid points. In term of full transient profile, Oldroyd-B constitutive equation represents the long lasting cylindrical filament probably due to the infinite extensibility of the polymer chain whereas Fene-CR demonstrates a low viscosity Newtonian like break-up. The polymer chain extension plays a role that need to be determined. Using the longest Zimm relaxation time extracted from the PAV LVE data as an input gives a good agreement between 5 and 7 ms, it cannot satisfactory represent the filament long time behaviour. An approach based on a single mode model may not be sufficient to describe properly the full process even for dilute polymer solutions and that a multi-mode model may be needed to better represent the behaviour at short and at long times.
IV Inkjet Processing
In order to correlate the fluid rheology with the micro droplet formation mechanism, an experimental rig has been realized to capture the fast transient drop profiles. The jetting rig is based on a DSLR camera (Nikon D90) equipped with a 10x lens mounted on a 12x Navitar ultra zoom. The opening of the camera shutter is used as a trigger (1) for both the droplet generation (2) with a delay Δt1, performed by a Xaar 1001, and the illumination (3) with a delay Δt1+Δt2, provided by a sparkflash nanolight (20ns white light pulse). The short illumination leads to capturing sharp contours of the droplet on the DSLR camera (4). Due to the very short time scale involved (ms) in the problem, high speed imaging is extremely difficult and expensive and was not possible until very recently. The reproducibility of the drop formation mechanism is used to solve this technical limitation. Recording different droplets at different illumination time shift Δt2 enable rebuilding the full droplet history. Figure 14 presents a diagram that explains the principal of the experimental set up. An automated control has been developed to ensure regular jetting and stable experimental conditions.
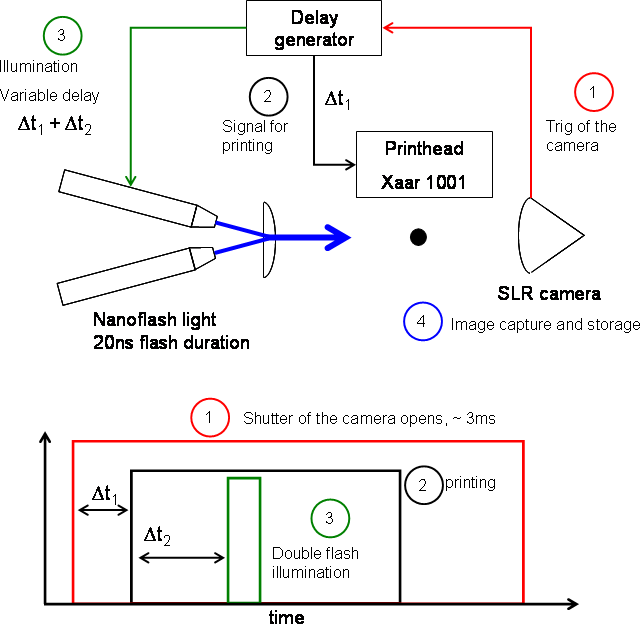 |
| Figure 14: Schematic diagram of the droplet visualisation experimental set up |
Figure 15 presents the transient profiles recorded during the jetting of matched viscosity mixture of DEP, DOP and PS110 at different concentration using a Xaar 1001 printhead. The wave form was similar for each experiment to investigate the effect of viscoelastic enhancement on the jetting mechanism.
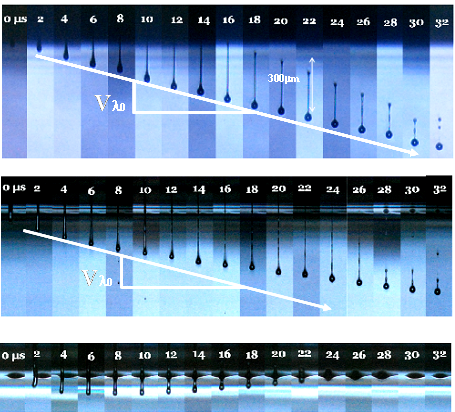 |
| Figure 15: Transient profiles recorded during the jetting of (a) DEP, (b) DEP/DOP + 0.2wt% PS1100 and (c) DEP/DOP + 0.5wt% PS110 using a Xaar 1001 printhead. η*: 17 mPa.s at 25°C. |
Addition of polymer clearly decreases the droplet speed until the droplet eventually does not detach from the nozzle plate when the PS110 concentration is of concentration 0.5wt% or above. Two different mechanisms associated with the viscoelastic nature of the fluid, or their combination, can cause such effect. The first mechanism is related to the Linear Viscoelastic (LVE) response of the fluid that can cause a delay (relaxation time λ) and storage (elastic constant g) of part of the energy coming from the printhead activation wave form. LVE data have demonstrated an increase in elastic modulus with polymer addition, which leads to longer relaxation l. Using Zimm model, relaxation of 0, 15 and 20µs have been extracted for polymer concentration of 0 wt%, 0.2wt% and 0.5wt% respectively. Alternatively, the slow down of the droplet can be due to the non Linear Viscoelasticity (NLVE) of the fluid. It has been shown here that the addition of polymer increases the extensional viscosity hE of the fluid leading to an apparent higher viscosity in the case of fast and important extension. As a result, both the break-up time at the nozzle and the dissipation of the kinetic energy of the droplet are increased. In the case of a too high ηE, the fluid can not detach and is eventually pulled back in the printhead. A closer look at the experimental transient profiles (Fig. 15.b) shows that the droplet front deviates from the Newtonian evolution after 10µs. This seems to indicate that NLVE is the leading reason behind the droplet slow down. However, the jetting mechanism is not perfectly reproducible and inaccuracy of order of 1 to 3 µs can be observed.
References
Anna, S. L., C. Rogers, and G. H. McKinley, “On controlling the kinematics of a filament stretching rheometer using a real-time active control mechanism,” J. Non-Newtonian Fluid Mech. 87, 307–335 (1999).
Crassous, J., R. Régisser, M. Ballauff, and N. Willenbacher, “Characterization of the viscoelastic behavior of complex fluids using the piezoelastic axial vibrator,” J. Rheol. 49, 851–863 (2005).
Clasen, C., J. P. Plog, W.-M. Kulicke, M. Owens, C. Macosko, L. E. Scriven, M. Verani, and G. H. McKinley, “How dilute are dilute solutions in extensional flows?” J. Rheol. 50(6), 849–881 (2006).
Gittes F, Schnurr B, Olmsted PD, Macintosh FC, Schmidt CF, “Microscopic viscoelasticity: shar moduli of soft materials determined from thermal fluctuations”, Phys Rev Lett 79, 3286–3289 (1997).
Hoath, S. D., G. D. Martin, T. R. Tuladhar, M. R. Mackley, D. Vadillo, and I. Hutching, “Link between ink rheology, drop-on-demand jet formation and printability,” J. Imaging Sci. Technol. 53, 041208 (2009).
McKinley, G. H., and A. Tripathi, “How to extract the Newtonian viscosity from capillary breakup measurements in a filament rheometer,” J. Rheol. 44, 653–670 (2000).
Manson T.G. and D.A. Weitz, “Linear viscoelasticity of colloidal hard sphere suspensions near the glass transition”, Phys. Rev. Letters, 75(14), 2770-2773 (1995).
Orr, N. V., and T. Sridhar, “Probing the dynamics of polymer solutions in extensional flow using step strain rate experiments,” J. Non-Newtonian Fluid Mech. 82, 203–232 (1999).
Pine D.J., D.A.Weitz, P.M. Chaikin and E. Herbolzheimer, Diffusive-Wave Spectroscopy, Phys. Rev. Letters, 60(12), (1988).
Rodd, L. E., T. P. Scott, J. J. Cooper-White, and G. H. McKinley, “Capillary breakup rheometry of lowviscosity elastic fluids,” Appl. Rheol. 15(1), 12–27 (2005).
Vadillo D.C., T. R. Tuladhar, A. C. Mulji, S. Jung, S. D. Hoath and M. R. Mackley, “Evaluation of the inkjet fluid’s performance using the “Cambridge Trimaster” filament stretch and break-up device”, J. Rheol, 54(2), 261-282 (2010)
Return to:

