The Polymer Fluids Group has a variety of facilities used for investigating Oscillatory Flow Mixing. The techniques and equipment used include:
Oscillatory Flow Reactors (OFR)
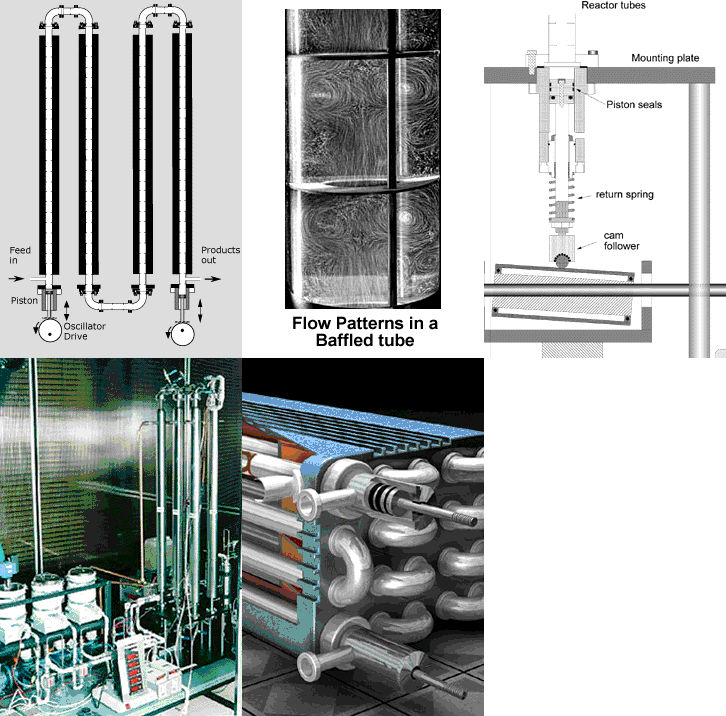 |
A typical oscillatory flow reactor (OFR) consists of an oscillation actuator, a baffled tube and ancillary equipment such as heaters, pumps and feed and product tanks, as seen in Figure 1. The Polymer Fluids Group has OFM equipment for a broad variety of applications at different scales, with mixing/reaction volumes of 0.001-10 litres for different continuous production applications. Several types of oscillatory flow actuators are possible, depending on the scale of the application. For very small reactors, pneumatic, electro-mechanical or miniature pump oscillators are most appropriate. For oscillators of 2-10 cm diameter, mechanical oscillators based on a rotating shaft with an eccentric and a piston follower are used. Larger oscillators (up to 1 m diameter) need larger power input and hydraulic systems are preferred. |
|
Figure 1. Different types of Oscillatory Flow Reactors |
OFRs must be tailored to the specific application in order to ensure material compatibility with the reactants and products. Ancillary equipment such as pumps and feed and product vessels are also chosen to suit the application.
 |
 |
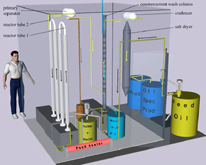 |
| Figure 2. Oscillatory meso-scale reactor. | Figure 3. Laboratory-scale oscillatory flow reactor. | Figure 4. Pilot-scale oscillatory flow reactor. |
Particle Imaging Velocimetry
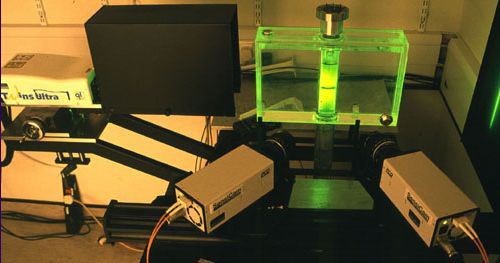
Through the UK Engineering and Physical Sciences Research Council (EPSRC) Multi-project Equipment scheme, the Polymer Fluids Group has acquired a high-resolution Particle Imaging Velocimetry (PIV) facility which allows direct experimental determination of two- and three-dimensional velocity fields in flow systems (Figure 4). PIV is an optical method for measuring particle velocities in flowing fluids by the use of digital image analysis. The principle of PIV operation is described below.
 |
|
Figure 5. Typical setup used for studying the flow patterns in OFM using stereo Particle Imaging Velocimetry. |
Two high-intensity laser pulses in the shape of a 4 mm wide vertical light sheet are fired through a target vessel containing neutrally buoyant seeding particles. The laser pulses are of very short duration and known time separation. Each of the two cameras (on the bottom of photograph above) records the instantaneous particle positions for each laser pulse. The images from each camera can be compared to see where the particles have moved, and thereby give the two-dimensional velocity of particle motion (left) as seen from each camera perspective.
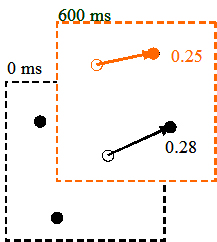 |
PIV software analysis correlates where the particles have moved and, given the correct laser pulse time separation, is able to give a detailed velocity field in the flowing fluid (Figure 5). By finally comparing the particle motion results between the two orthogonally placed cameras, three-dimensional velocity information can be computed. For OFM work, the PIV facility is used to determine velocity fields in different OFM geometries and flow regimes. |
|
Figure 6. Cross-correlation of seeding particles in PIV. |
Laser Doppler Anemometry
The Polymer Fluid Group has acquired a Lase Doppler Anemometry (LDA) system which can be used for studying transient flow in OFM. The LDA is a widely accepted tool for fluid dynamic investigations in gases and liquids and has been used as such for more than three decades. It is a well-established technique that gives information about flow velocity.
It's non-intrusive principle and directional sensitivity make it very suitable for applications with reversing flow, chemically reacting or high-temperature media and rotating machinery, where physical sensors are difficult or impossible to use. It requires tracer particles in the flow.
The method's particular advantages are: non-intrusive measurement, high spatial and temporal resolution, no need for calibration and the ability to measure in reversing flows.
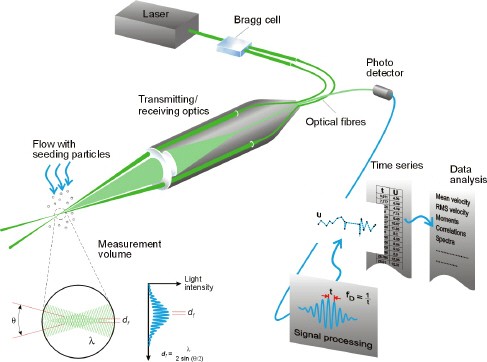
The basic configuration of an LDA (Figure 6) consists of:
- A continuous wave laser;
- Transmitting optics, including a beam splitter and a focusing lens;
- Receiving optics, comprising a focusing lens, an interference filtre and a photodetector;
- A signal conditioner and a signal processor.
 |
|
Figure 7. Diagram showing the operating principles of LDA (from http://www.dantecdynamics.com/) |
Computational Fluid Dynamics
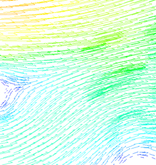
The Polymer Fluids Group uses the latest Fluent/Ansys and Fastflow Computational Fluid Dynamics software together with state-of-the-art computer hardware to establish flow patterns in OFM systems and compare these with experimentally obtained data from PIV and optical measurements.
 |
|
Figure 8. Example of flow pattern in OFM as modelled by CFDs. |
Residence Time Distribution
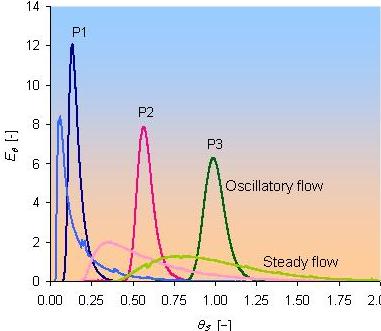
Residence time distribution (RTD) measurements are very useful for determining the behaviour of process systems and these have in the past been extensively used in documenting the performance of OFM technology. By injecting a tracer pulse in one OFM cavity and measuring the downstream tracer concentration with time (Figure 7), the axial dispersion under various OFM conditions can be determined.
The Polymer Fluids Group uses state-of-the-art optical fiber technology, an Avantes AvaSpec 2048, for the real-time measurement and data logging of tracer concentrations at different points in OFM reactors. The data obtained can be fitted to axial dispersion models to give information about the uniformity of mixing produced by different OFM geometries and net and oscillatory flow conditions.
 |
|
Figure 9. Typical RTD curves in a 10-m long continuous oscillatory meso-reactor. The light lines represent time residence curves for steady-flow (i.e. in the absence of oscillatory flow); dark lines show residence time response when the oscillatory flow is superimposed into the net flow. Oscillatory conditions were: f=10 s-1, x0=2 mm, Reo=657. Locations of probes were: P1=1 m from the injection; P2=5 m from the injection; P3=9 m from the injection. Residence time =10 min. |
High-Speed Optical Recording
The Polymer Fluids Group has several digital still and movie cameras, including a high-speed camera with the capability of recording up to 10,000 frames per second. This is a powerful tool for investigating transient fluid mixing phenomena such as droplet breakup in oscillatory shear flow in periodically constricted tubes (Figure 8). The picture is one of a sequence taken of high-intensity oscillatory flow of oil droplets in water in a single cavity of a meso-scale OFM tube.
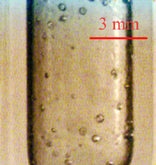 |
| Figure 10. Droplets size in water-oil dispersion in a single cavity of a meso-scale OFM tube |

