An investigation of the residence time distribution (RTD) behaviour of the laboratory scale oscillatory flow reactor has been performed to investigate and quantify the relative contributions of the oscillatory flow and bulk flow components in the baffled tube reactor.
Experimental
Experiments were performed in a two pass reactor configuration. Each reactor vessel was a 1.4 m long shell-and-tube vessel, 70mm shell diamter/24mm i.d. tube diameter fitted with 75% constricting orifice type baffles, spaced at 1.5 tube diameters. A salt (KCl) tracer was injected at the inlet to the reactor, and the concentration-time behaviour was measured on-line at the outlet, using a flow cell, conductivity meter, and data logging system. The injection was assumed to approximate to a perfect pulse injection, which was reasonable given the time scale of experiment (>10min) and the injection time (0.5s). The standard, single-parameter tanks-in-series model was employed to model the experimental concentration-time data. Although this model is not the most sophisticated, it has the advantage that it has some resemblance to the physical system, where the sequence of baffled cavities in the reactor tube can be regarded as a series of stirred tanks as shown in Figure 1.
 |
| Figure 1. Vortex rings generated in a baffled tube under oscillatory flow conditions. |
An iterative graphical procedure was used to perform the modeling, using Microsoft Excel for data processing and graph plotting. This involved generating the dimensionless E-curve for experimental concentration-time profiles of each experiment, and to compare these with predicted E-curve from the tanks-in-series model. The number of tanks-in-series (N) which gave the best match by overlap on the E-curve to the experimental data was then taken as the model fit. An advantage of this method is that by comparing the span and height of the experimental and model E-curves it can be clearly seen if the tanks-in-series model is valid, whereas with calculation methods, a value of N can be obtained irrespective of whether the model is appropriate or not. The actual number of baffled cavities in the two pass reactor configuration is 80, which represents the ideal value for N assuming each baffle cavity behaves as a perfect stirred tank. In reality, it is expected that the experimentally determined values will all be less than ideal, but the closer to N = 80, the closer the system will be to ideal behaviour.
Results
With the net flow rate set as the main parameter, the effect of frequency and amplitude was investigated for four flow rates corresponding to net flow Reynolds number = 95, 127, 190, and 252. We investigated a range of amplitudes and frequencies to obtain oscillatory Reynolds numbers in the range oscillatory Reynolds number = 0-2500.
 |
|
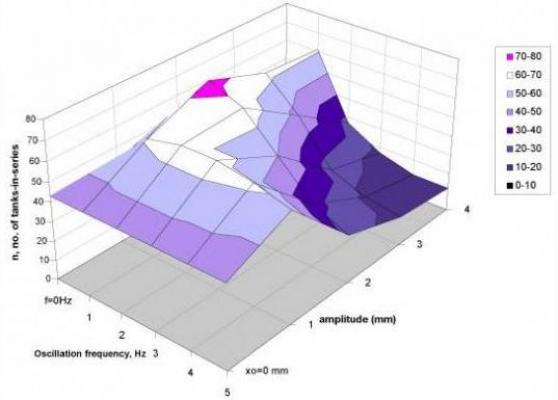
Figure 2. Effect of oscillation amplitude and frequency on RTD at a Ren = 127. |
The sensitivity of the RTD response to amplitude and frequency is shown for an intermediate net flow Reynolds number in the 3D surface in Figure 2 above. It can be seen that N (number of tanks-in-series) is more or less equally sensitive to both amplitude and frequency, and there is an optimum region where N is maximised. This means that the RTD response can be controlled by manipulation of amplitude and frequency at given net flow conditions.
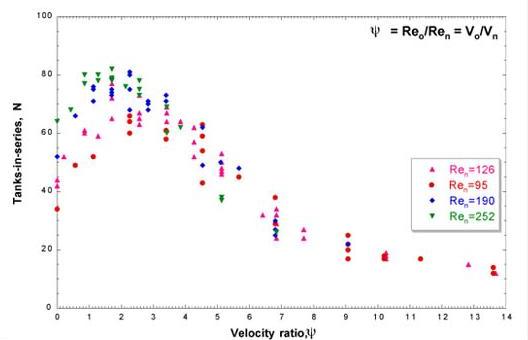
The effect of the bulk flow conditions on the RTD response is shown in Figure 3 below, which plots N against the velocity ratio. Each curve on the graph represents the complete set of data obtained by varying the amplitude and frequency for a particular value of net flow Reynolds number. It can be seen from the graph that for each flow rate considered there is a clear range for the velocity ratio for which N is largest, and thus where the system is operating closest to the ideal value of N (80). Also, the higher the net flow rate, the higher is the magnitude of N (i.e. the closer to the ideal N) in the optimum region. This is probably due to the fact that for the higher flow rate, the residence time is correspondingly shorter, which means there is less chance for axial dispersion to occur, and this translates to a higher overall value for N.
 |
| Figure 3. RTD behaviour as a function of velocity ratio, ψ. |
It can be seen in the graph that the optimum value of the velocity ratio for each flow rate occurs in the range 1.8-2.5. For reactor design purposes, the use of the velocity ratio might be envisaged as follows. From the reaction kinetics of a particular reaction, the residence time would be specified. From the residence time, and fixed volume of the reactor, the throughput would be determined. The net flow Reynolds number would then be calculated from the superficial net flow velocity. Using velocity ratio=2 as a starting point, the value of the oscillatory Reynolds number could then be calculated, and this would enable one to select the appropriate combination of frequency and amplitude (for a given geometry) to ensure that the mixing falls within the optimum RTD regime.
Conclusions
It has been shown that the RTD performance can be achieved in the baffled tube is close to the ideal condition where the each of the baffle cavities behaves as a series of ideal, stirred tanks. This means that optimum RTD can be achieved in a tubular reactor independently of the throughput, by selecting the appropriate (superimposed) oscillatory conditions.

